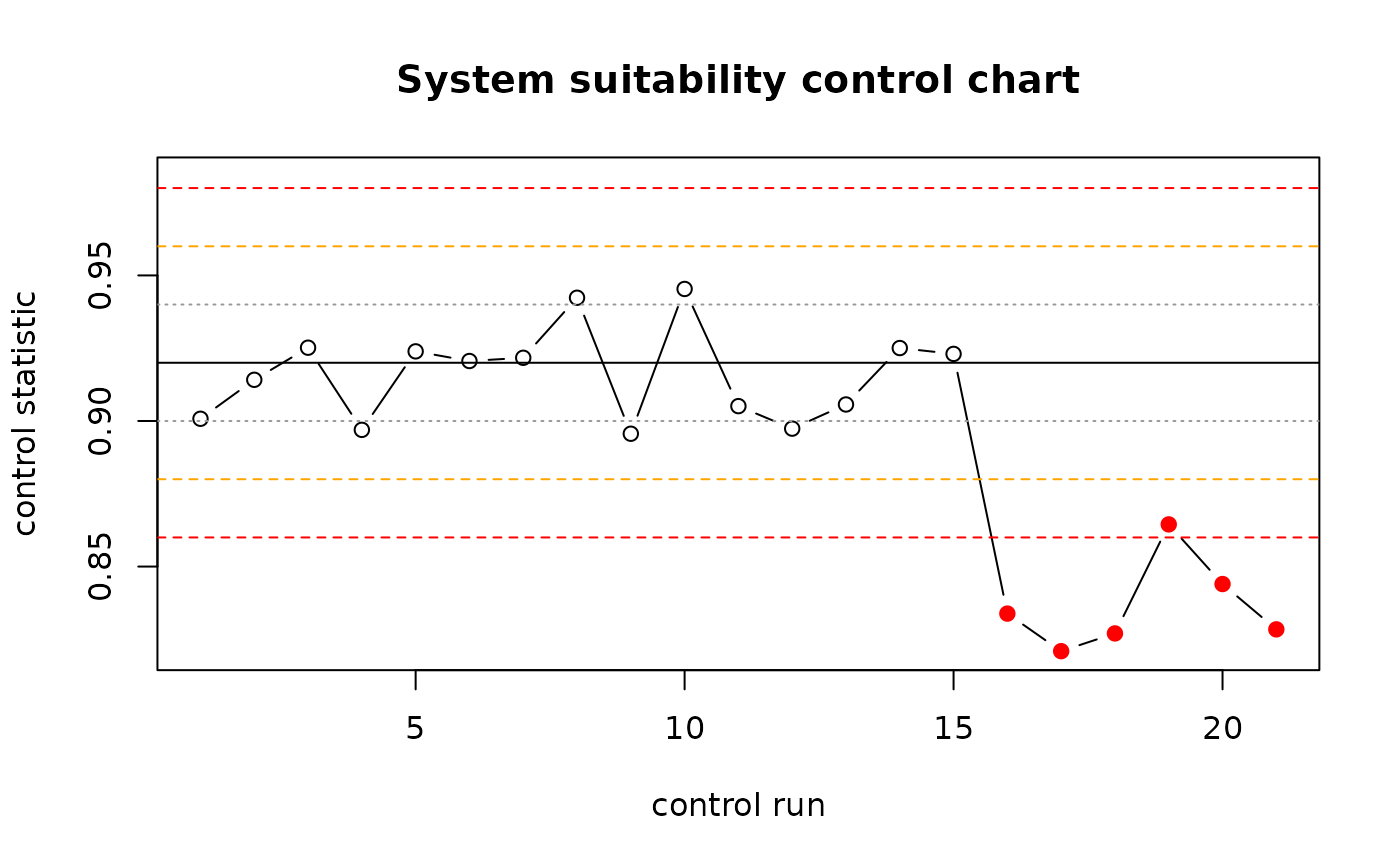
Control chart with Westgard rules for ongoing system suitability
Source:R/spc.R
msa_control_chart.RdA validation is a snapshot; providers change models silently, prompts are edited and endpoints drift. Clinical laboratories handle the same problem with control samples run alongside every batch and judged with Westgard multi-rules. The same applies here: keep a small control set with known answers, run it before every productive batch, and chart the control statistic (for example the percent correct, or the mean parsed value) over time.
Usage
msa_control_chart(
  x,
  center = NULL,
  sd = NULL,
  n_baseline = 10,
  rules = c("1_2s", "1_3s", "2_2s", "R_4s", "4_1s", "10_x")
)
Arguments
- x
Numeric control statistic in time order.
- center, sd
Target center and standard deviation, typically from the validation study (e.g. the mean and sd of the control statistic across its replicates). If
NULL, estimated from the firstn_baselinevalues.- n_baseline
Number of initial values used to estimate
centerandsdwhen they are not given.- rules
Rules to evaluate.
Value
A data.frame of class msa_control_chart with x, z, a
logical column per rule and reject (any rejection rule fired;
1_2s is a warning only).
Details
Implemented rules on the z-scores (x - center) / sd:
1_2s (warning, one value beyond 2 sd), 1_3s (one value beyond 3 sd),
2_2s (two consecutive values beyond 2 sd on the same side),
R_4s (two consecutive values differing by more than 4 sd),
4_1s (four consecutive values beyond 1 sd on the same side),
10_x (ten consecutive values on the same side of the center).
Examples
set.seed(3)
acc <- c(rnorm(15, 0.92, 0.02), rnorm(6, 0.84, 0.02))  # drift after a silent model update
cc <- msa_control_chart(acc, center = 0.92, sd = 0.02)
cc[cc$reject, ]
#> Control chart: 6 points, center 0.9200, sd 0.0200; 6 rejection(s)
#>   rules fired: 1_3s (5), 2_2s (5), R_4s (1), 4_1s (3)
#>  index         x         z 1_2s  1_3s  2_2s  R_4s  4_1s  10_x reject
#>     16 0.8338469 -4.307656 TRUE  TRUE FALSE  TRUE FALSE FALSE   TRUE
#>     17 0.8209397 -4.953017 TRUE  TRUE  TRUE FALSE FALSE FALSE   TRUE
#>     18 0.8270351 -4.648243 TRUE  TRUE  TRUE FALSE FALSE FALSE   TRUE
#>     19 0.8644863 -2.775686 TRUE FALSE  TRUE FALSE  TRUE FALSE   TRUE
#>     20 0.8439962 -3.800188 TRUE  TRUE  TRUE FALSE  TRUE FALSE   TRUE
#>     21 0.8284303 -4.578484 TRUE  TRUE  TRUE FALSE  TRUE FALSE   TRUE
plot(cc)